Intro: The Polite Number and the Ugly One
Your salary is the polite number. It wears a collared shirt. It sounds impressive at dinner.
Your annual spend is the ugly number. It is the one hiding in the drawer with the mystery cables, expired coupons, and that one receipt from a purchase you swore was “basically free” because it was on sale.
Most people know what they earn. Far fewer know what they actually spend in a year. Not what they think they spend. Not the clean little version from the checking account they look at most often. The real number, across checking, savings, credit cards, payment apps, joint accounts, “emergency” cards, store cards, and whatever other financial side quests your household has collected.
This matters because spending is not one neat monthly pattern. The BLS reported that the average U.S. consumer unit spent $78,535 in 2024, with housing, transportation, food, healthcare, and personal insurance and pensions making up most of the total. The BEA tracks personal consumption expenditures nationally because consumer spending is not trivia. It is the big, loud engine room of household life.
And your household? It has receipts.
TL;DR
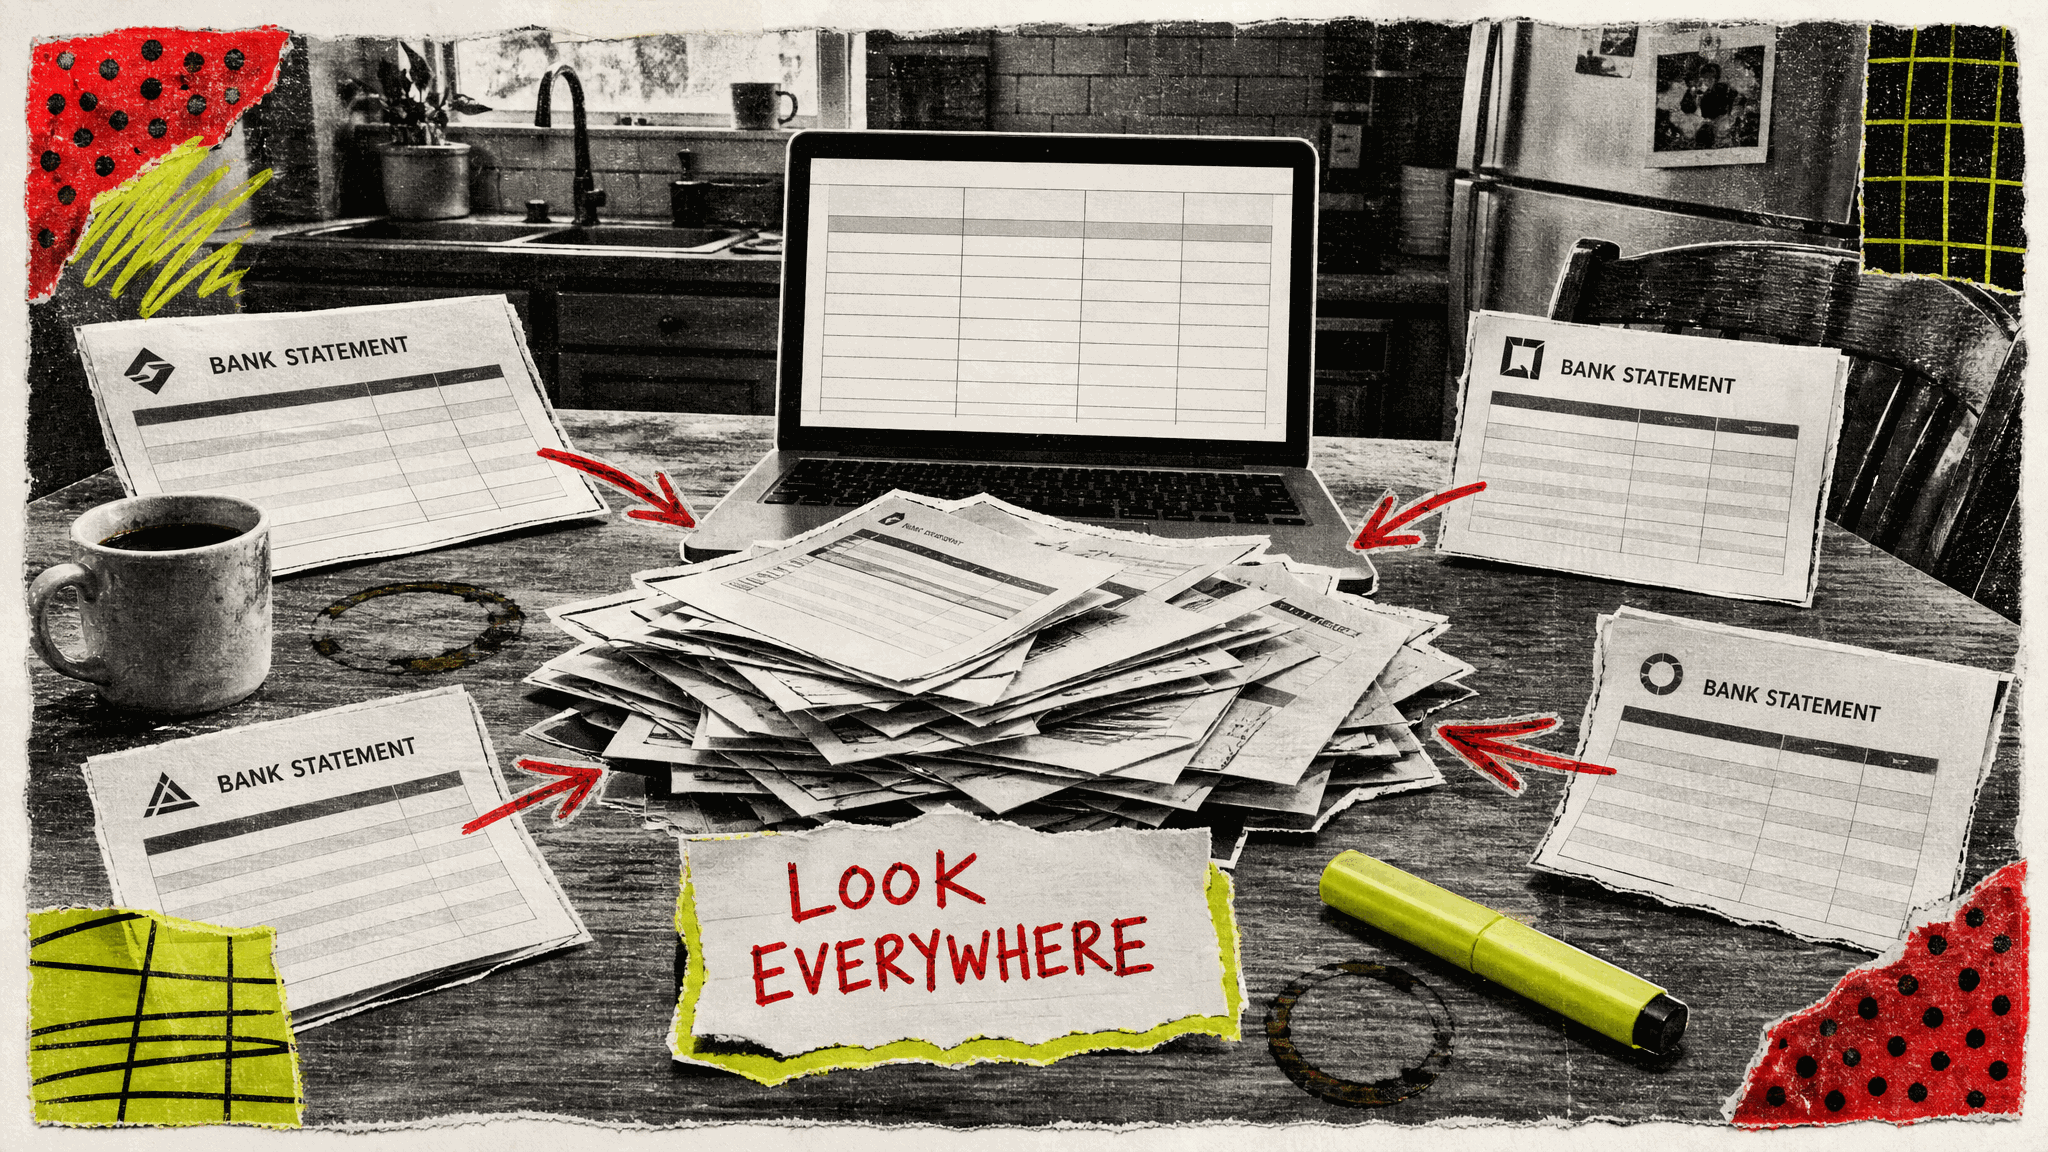
- Pull 12 months from every account, not just your favorite checking account.
- Your real number is normalized annual outflows minus transfers, refunds, reimbursements, and true one-offs.
- The forbidden act is looking everywhere, then refusing to turn the answer into a shame ritual.
The data pull
Start with 12 full months. Not “since January,” unless it is December and you are feeling theatrical. You want a rolling year because life has seasons: insurance renewals, summer travel, school fees, holiday spending, tax refunds, bonus months, and the annual subscription that appears once like a raccoon in a chimney.
Pull transactions from every place money enters or leaves:
- Primary checking
- Secondary checking
- Savings accounts with bill payments or transfers
- Every credit card
- Joint accounts
- Payment apps
- Store cards
- Buy-now-pay-later accounts
- Cash withdrawals, if cash is a real spending category for you
Yes, this is annoying. So is discovering in October that “we spend about $5,000 a month” was actually “we spend $6,200 a month but only $5,000 had the decency to appear in the account we check.”
The CFPB says there is no restriction on how many checking or savings accounts you can open, which is useful freedom and also how a normal household becomes a small financial archipelago. One account gets payroll. Another pays the mortgage. A card handles groceries. A payment app buys concert tickets. A joint account exists because love is real and so are utility bills.
Cross-institution aggregation is not a fancy feature here. It is the work. If you only look at primary checking, you are measuring the hallway and calling it the house.
Export CSVs if you like spreadsheets. Use a budgeting app if you like automation. Print statements if you enjoy paper cuts and emotional archaeology. The format matters less than the boundary: every institution, 12 months, all inflows and all outflows.
Then remove transfers between your own accounts. Moving $1,000 from checking to savings is not spending. Paying a credit card from checking is not spending if the card transactions are already counted. Double-counting transfers is how your annual spend turns into a haunted carnival mirror.
If you need a broader framework before choosing a system, Which Budgeting Method Is Right for You? is the calm decision tree for people who do not want budgeting religion.
Normalize the one-offs
Now comes the part where your spreadsheet starts telling stories.
A new roof. A wedding. A hospital bill. A car repair involving a mechanic sighing before speaking. These are real expenses, but they may not represent your ordinary annual run rate.
Do not delete them blindly. Normalize them.
There are three buckets:
True one-offs
These are expenses that are real but not expected to repeat soon. A new roof is the classic example. If you spent $18,000 replacing it, counting the full amount as “normal annual spending” may make your lifestyle look permanently larger than it is.
Instead, show two numbers: actual annual spend and normalized annual spend. Actual is what happened. Normalized is what your life costs in a typical year.
Irregular but predictable
These are not surprises. They are just rude about timing. Car insurance, holiday gifts, annual software renewals, property taxes, school fees, and travel all belong here.
The right move is not to pretend they are one-offs. It is to annualize them and, ideally, fund them monthly. That is the whole point of sinking funds. If you need the clean version, Sinking Funds Explained: The One Habit That Makes ‘Surprise’ Expenses Disappear is where the boring magic lives.
Lifestyle spikes
These are not emergencies. They are “we had three weddings, two long weekends, and a furniture moment.” Flowers that begin dying immediately. Hotel rooms priced like they include minor royalty rights. Outfits purchased because the dress code said “garden formal,” which is apparently a threat.
Normalize carefully. If this year had unusual travel, adjust it. If every year has unusual travel, congratulations, that is your life now. Put it in the number.
JPMorganChase Institute research found that median-income households had expenses fluctuate by nearly $1,300, or 29 percent, month to month. That is why a single month is a terrible narrator. It lies with confidence.
Above vs. below the line
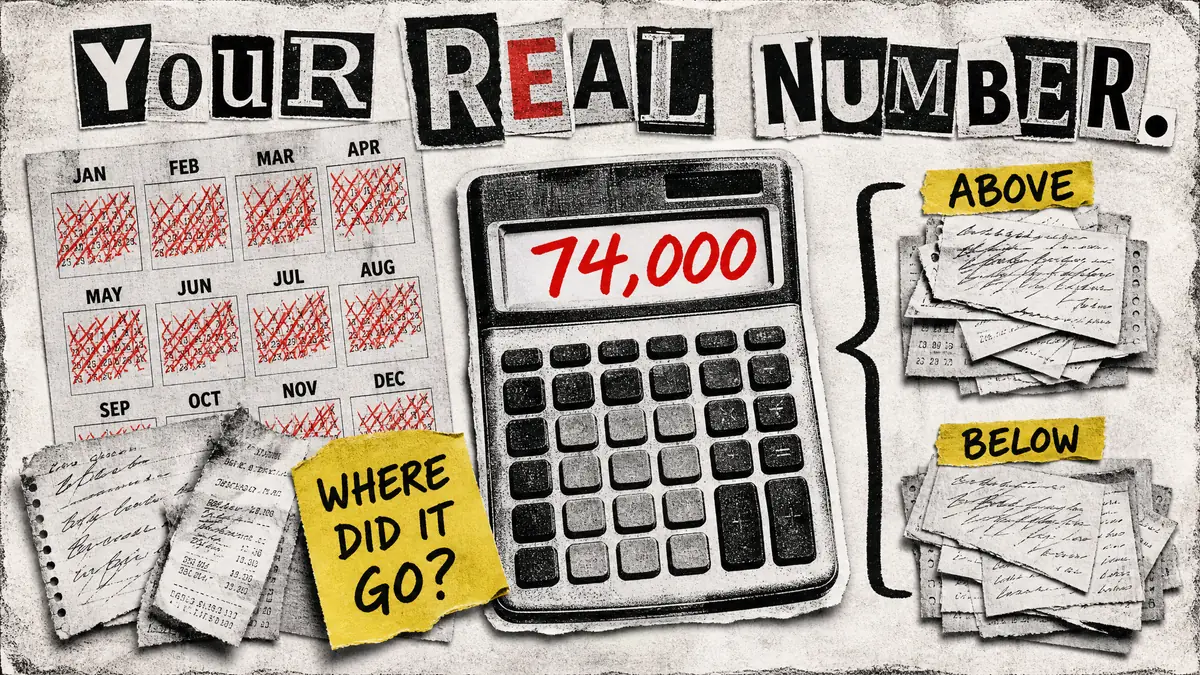
Once you have clean annual spending, split it into above-the-line and below-the-line.
Above-the-line is the unavoidable structure of your life: housing, transportation, food, insurance, baseline childcare, utilities, debt minimums, and medical needs. These are not morally superior expenses. They are just harder to move without changing the architecture of your life.
Below-the-line is everything more flexible: subscriptions, delivery, upgrades, hobby spending, impulse buys, convenience fees, unused memberships, and lifestyle drift. Again, not evil. The latte is not your problem. Your rent is your problem. But below-the-line spending is usually where leaks hide because it arrives in little taps instead of one dramatic flood.
The BLS reported that housing and transportation accounted for just over half of average U.S. household spending in 2024, while food added another 12.9 percent. Translation: the big stuff is big. Groundbreaking, we know.
| Category | Above-the-line | Below-the-line |
|---|---|---|
| Housing | Rent, mortgage, property tax, basic utilities, required insurance | Decor upgrades, storage unit drift, premium services you forgot you added |
| Transport | Car payment, fuel, transit pass, required insurance, maintenance | Ride-share by default, parking laziness, upgrades, avoidable delivery fees |
| Food | Groceries, basic household staples, necessary school or work meals | Delivery, restaurant creep, snack runs, “we have food at home” denial spending |
| Health and family | Insurance premiums, prescriptions, childcare required for work, medical bills | Nice-to-have wellness purchases, unused classes, duplicate services |
| Debt and obligations | Minimum payments, taxes due, required fees | Late fees, interest caused by timing mistakes, avoidable penalty charges |
| Lifestyle | Basic phone plan, necessary clothing, work tools | Subscriptions, upgrades, hobbies, travel, gifts, convenience spending |
This split is powerful because it stops the budget from yelling at the wrong thing. If 70 percent of your spending is above the line, a subscription audit alone will not rescue you. It may still help, especially if your recurring charges have been breeding quietly in the background. Start with Sub-Hunting: How to Find $50-$200/Month Hiding in Your Recurring Charges if you suspect the apps are unionizing.
The formula
Here is your real number:
Real annual spend = total 12-month outflows from all accounts - transfers - credit card payments already counted - refunds - reimbursements - true one-offs + normalized irregular expenses
That is the ugly number. Not your salary. Not your take-home pay. Not your ideal budget. Your actual cost of living, adjusted so one freak expense does not turn into a fake identity crisis.
You can also calculate three related numbers:
Actual annual spend: what left your household in the last 12 months.
Normalized annual spend: what your household costs in a representative year.
Monthly burn rate: normalized annual spend divided by 12.
The monthly burn rate is the number you compare against take-home pay. Not gross salary. Gross salary is a fantasy number with payroll deductions wearing tiny costumes.
If you earn $90,000 but take home $68,000 after taxes, insurance, retirement contributions, and payroll deductions, your household does not live on $90,000. It lives on what arrives. For reading the paycheck side of that equation without squinting at abbreviations like you are decoding a submarine manual, see How to Read a Pay Stub Like You Mean It.
A useful add-on:
Explainability gap = uncategorized or initially unexplained spending / total actual annual spend
This is the percent of spending you could not explain on the first pass. The goal is not zero. The goal is “low enough that you are not operating a mystery economy.”
The worked example
Meet a household with a $90,000 salary. They think they spend about $5,000 a month because that is what leaves primary checking.
Reasonable. Wrong, but reasonable.
They pull 12 months from every account. Primary checking shows bills, mortgage, utilities, groceries, and credit card payments. Then they add the credit card transactions themselves, remove the card payments to avoid double-counting, include a secondary checking account used for childcare, and add payment app activity.
The forbidden act of actually looking has consequences.
| Line item | Amount | What happened |
|---|---|---|
| Gross salary | $90,000 | The polite number everyone remembers |
| Estimated spend from primary checking | $57,720 | Looked like $4,810 per month |
| Credit card spending not visible in checking categories | $9,840 | Groceries, fuel, household purchases, restaurants |
| Secondary checking outflows | $4,920 | Childcare copays, activities, a few annual bills |
| Payment app and store-card spending | $3,520 | Gifts, tickets, small purchases with big collective energy |
| Total actual annual outflows | $76,000 | The first ugly number |
| Less true one-off | -$5,000 | Wedding travel cluster that will not repeat next year |
| Add normalized irregular expenses | $3,000 | Annual insurance, holiday gifts, maintenance reserve |
| Real annual spend | $74,000 | The number to plan around |
| Monthly burn rate | $6,167 | $74,000 divided by 12 |
| Initially unexplained spending | $16,720 | 22 percent of actual outflows needed investigation |
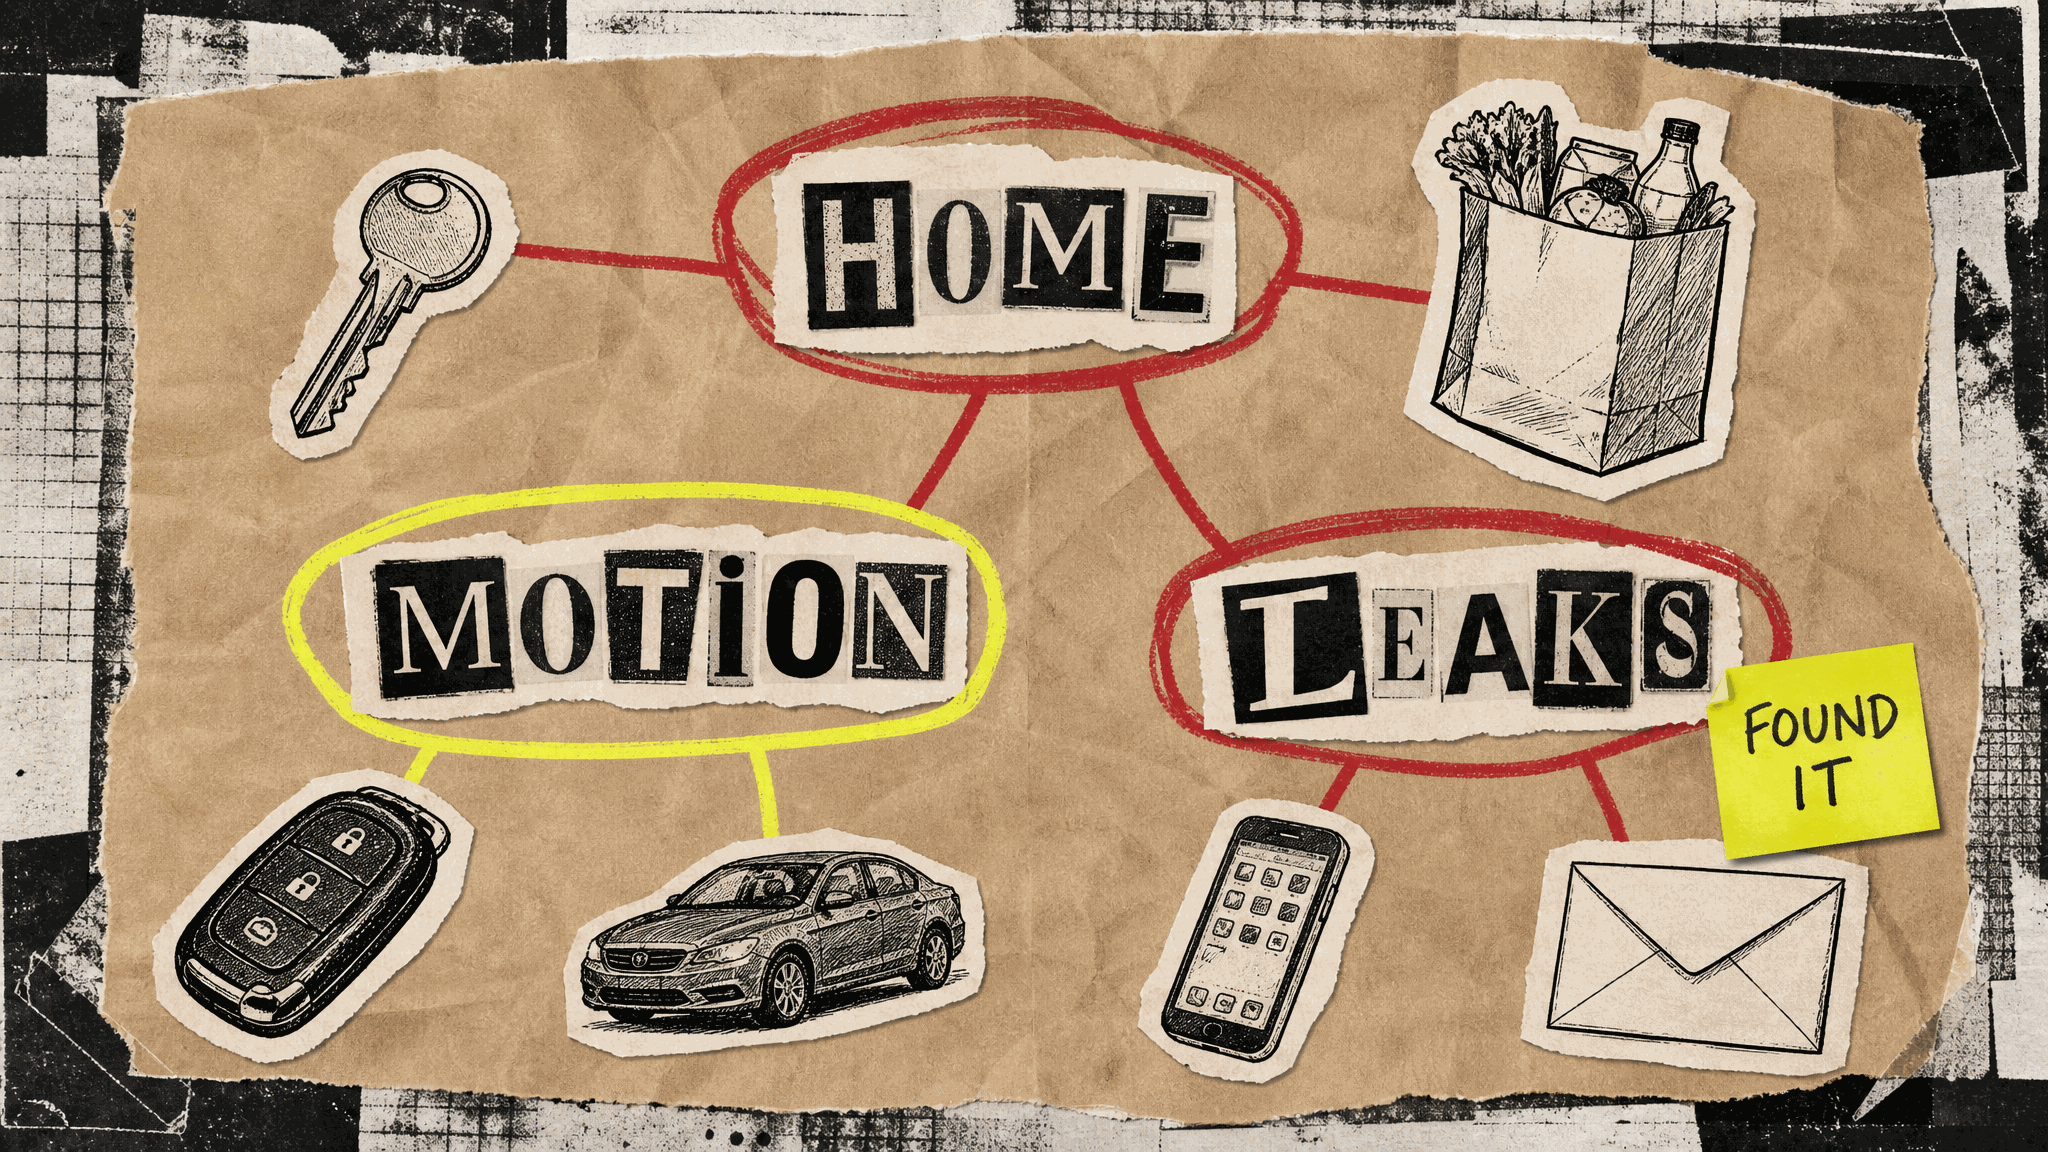
Notice what did not happen. Nobody had to declare bankruptcy because of burritos. Nobody had to become a monk. The household simply found the real number.
The discovery is not “you are bad with money.” The discovery is “your system was only watching part of the room.” Very different. Much less annoying.
Now they can make adult decisions with adult math. If take-home pay is below $74,000, something has to change. Maybe income. Maybe housing. Maybe transport. Maybe the below-the-line leaks. Maybe all of it, gently and in stages, because life is not a budgeting worksheet with perfect lighting.
If take-home pay is above $74,000, the leftover exists. It may be smaller than hoped, but it is real. That leftover can build an emergency fund, pay down debt, fund sinking funds, or automate investing. Pick the method that fits the life you actually have, not the one a stranger on the internet assigned you.
That is the point of the ugly number. It gives you the floorplan. You can renovate after you stop pretending the basement is not there.
You earn the salary. You live on the leftover. The leftover is more than you think.

 Forbidden Finance