The Fifty–Thirty–Twenty Rule: The Budget That Launched a Thousand Internet Arguments
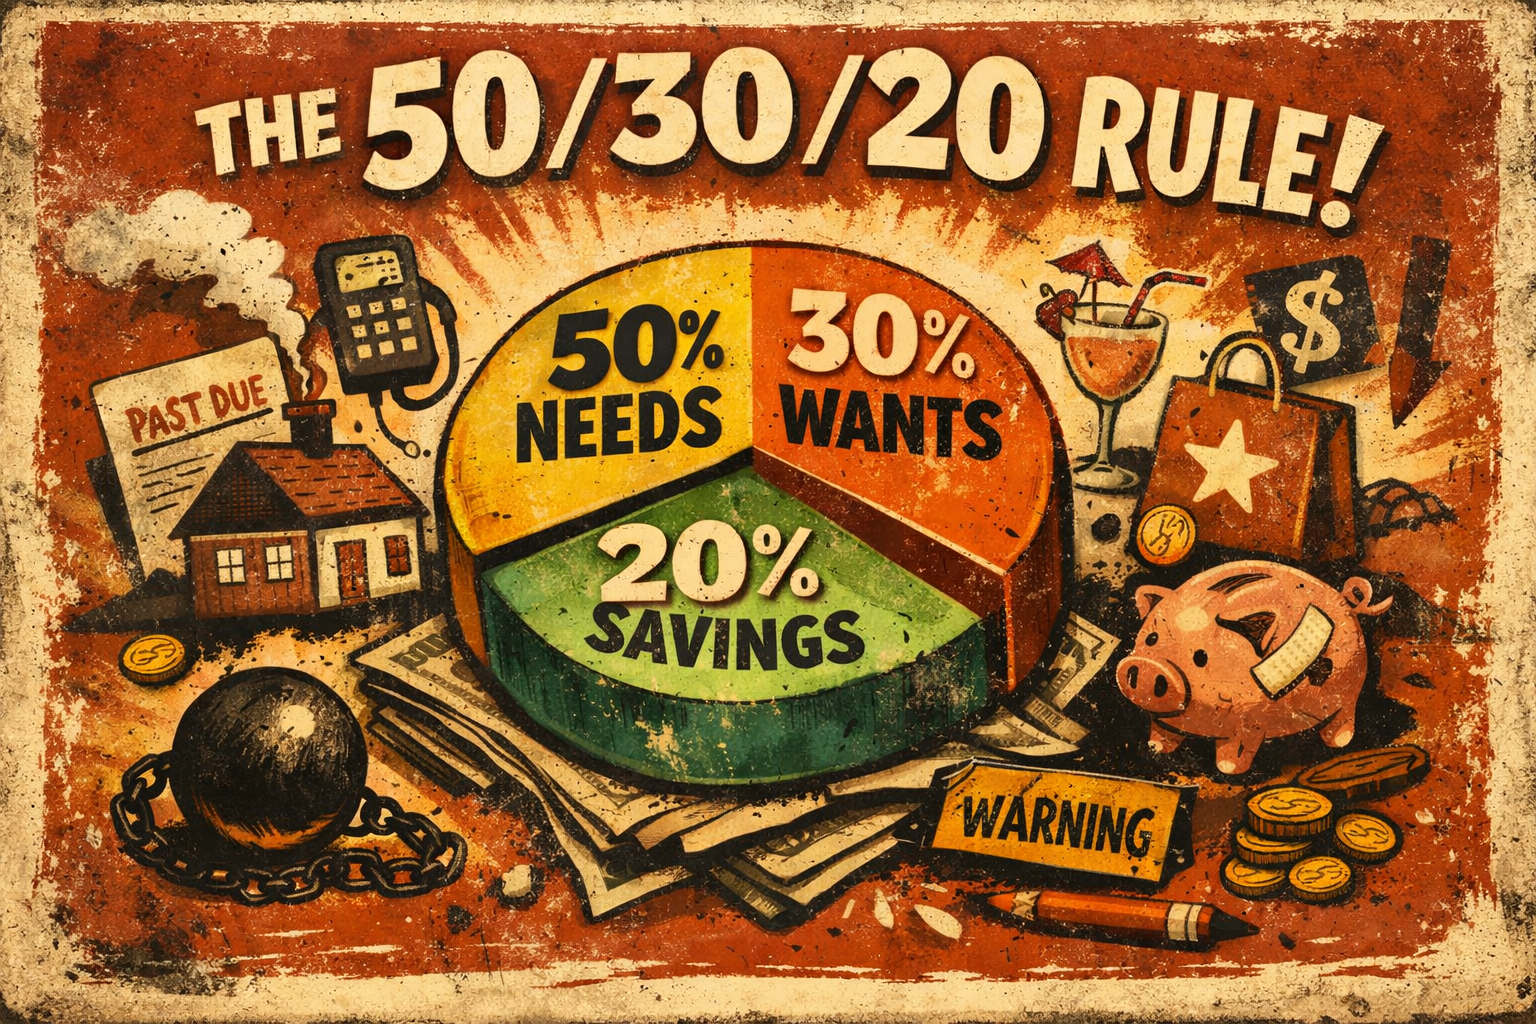
If budgeting has ever made you feel like you’re being graded by a spreadsheet, this rule is the “chill professor” version. It’s a simple framework that splits your after-tax (net) income into three buckets: Needs, Wants, and Savings (and/or debt payoff).
And yes: people still manage to fight about it anyway, because the internet can turn a toaster manual into a culture war. That doesn’t mean the rule is bad; it just means you should treat it like a guideline, not a law of physics.
What the rule actually is
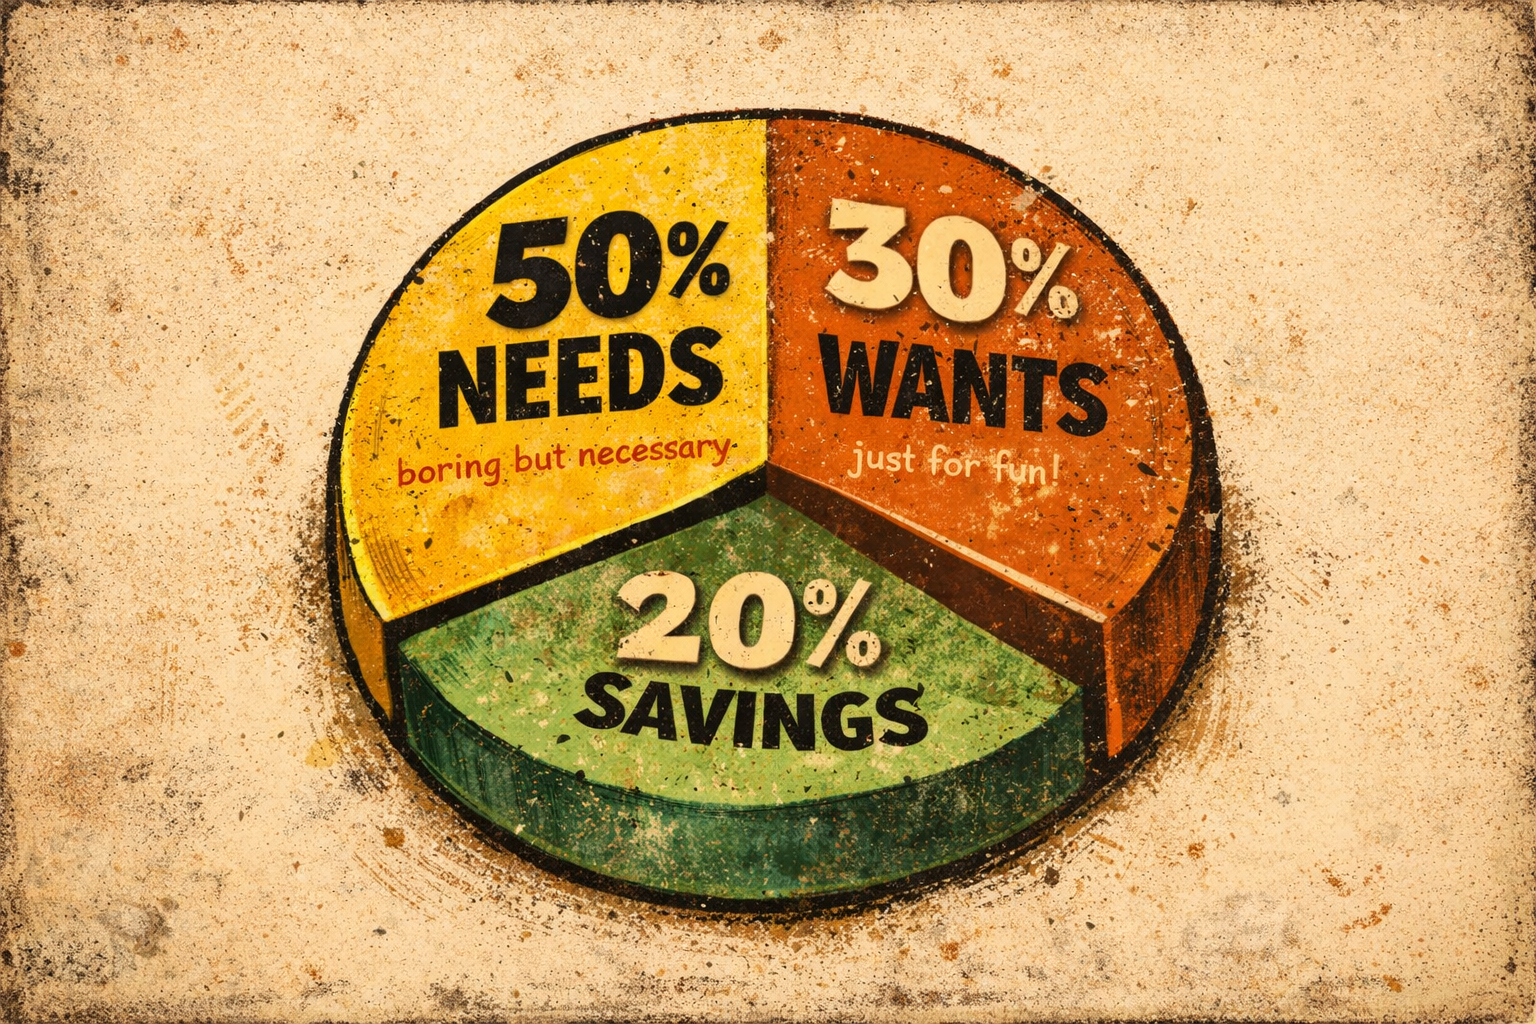
The core idea is straightforward: aim to put about half your take-home pay toward the stuff you must pay, about a third toward lifestyle and optional spending, and about a fifth toward future-you (savings, investing, and/or extra debt payments).
It’s usually described as a “budget rule of thumb,” because you’re not supposed to tattoo it on your forearm and cry when groceries spike. (You can cry. Just don’t blame yourself like a Victorian orphan.)
Here’s what the math looks like when you apply it to monthly net income:
| Monthly net income | Needs (about half) | Wants (about a third) | Savings & extra debt payoff (about a fifth) |
|---|---|---|---|
| $4,000 | $2,000 | $1,200 | $800 |
This is the point: you get a fast “is my money roughly in balance?” check without tracking 47 micro-categories like “snacks I bought because the universe is cruel.”
Where it came from and why it stuck
The rule is widely credited to Elizabeth Warren and Amelia Warren Tyagi, who popularized it through their personal finance book All Your Worth: The Ultimate Lifetime Money Plan. The book was published by Simon & Schuster in 2005, and it frames budgeting as balancing spending across essentials, enjoyment, and savings rather than obsessing over every penny.
A big reason it stuck is that it reduces budgeting to three decisions instead of turning your bank statement into required reading for a midterm. It’s also been cited and re-cited across personal finance media for years, giving it that “everyone knows it… even if nobody follows it perfectly” status.
What counts as needs, wants, and savings
This is where the rule stops being math and starts being philosophy. In simple educational versions, Needs include core living costs (housing, groceries, utilities, transportation), Wants include discretionary spending (dining out, vacations, entertainment), and Savings includes emergency savings, retirement, and paying down debt.
Here’s a practical map most people recognize, plus the “gray area” that fuels the comment-section bonfire:
| Bucket | Usually includes | Common fights about |
|---|---|---|
| Needs | Rent/mortgage, groceries, utilities, transportation | How much “housing” is too much |
| Wants | Dining out, vacations, entertainment | Subscriptions, hobbies, “little treats” |
| Savings (and/or debt) | Emergency fund, retirement, paying down debt | Whether debt payoff belongs here or in Needs |
Even official guidance flags that the rule doesn’t fit everyone. To quote an educational budgeting guide from the Consumer Financial Protection Bureau: “Not everyone can follow it.”
The “need vs want” tiebreaker that saves your sanity
When something feels borderline, use a tiebreaker that isn’t based on guilt. If skipping it would risk your housing, health, job, or legal/credit standing, it’s a Need; if it’s optional or mainly improves comfort/entertainment, it’s a Want.
Debt is the classic tricky one. Minimum payments often behave like Needs (because consequences), while extra payments are closer to “Savings/financial goals,” which is why some guidance explicitly groups savings and debt together.
Why the rule breaks and how to fix it
The biggest criticism is also the simplest: in high-cost areas—or during “everything is expensive now” eras—your Needs can bulldoze the whole framework. Housing is usually the main culprit, and public policy commonly treats spending more than 30% of income on housing as “cost-burdened.”
That matters because if your housing alone is already pushing past that line, squeezing all Needs under “about half” can be fantasy math. A 2024 press release from the U.S. Census Bureau notes the standard definition (spending more than 30% on housing) and reports that many renter households meet that threshold, with “severely cost-burdened” commonly defined as more than 50%.
International comparisons show similar pressure when housing takes a big bite. The Organisation for Economic Co-operations and Development (OECD) tracks “housing cost overburden” using a 40% disposable-income threshold, and its methodology notes that in some places a significant share of tenants are over that line—meaning housing can crowd out both Wants and Savings fast.
The rule can feel like “budget shaming” if you treat it as a morality test
When people can’t hit the targets, the rule sometimes gets blamed for “making people feel bad,” even though it’s supposed to be diagnostic. One UK bank’s explainer puts it plainly (and sympathetically): “Some people find… it’s not possible to get all essentials into the 50% bracket… in a central city.”
The fix isn’t “try harder.” The fix is “change the targets to match reality,” because you’re building a budget, not auditioning for Financial Perfection Olympics.
Irregular income needs a different starting point
If your income varies, the rule still can work, but you need an averaging step so you aren’t budgeting off a “great month” and then panicking during a normal one. One mainstream guide suggests using an average of recent months when income changes from month to month.
In practice, percentage-based rules are most useful when they reduce chaos. If your cashflow is unpredictable, your first “Savings” priority may be building a buffer so the rest of the budget can stop flailing.
Common variations people use
Most real people don’t live exactly inside the original split. They adapt it.
A common set of alternatives shifts more toward Needs in expensive places, or shifts more toward Savings when you’re aggressively building security.
| Variation | What it changes | When it tends to work better |
|---|---|---|
| 60/20/20 | More room for Needs | High rent, high baseline bills, early-career income |
| 70/20/10 | Even more room for Needs, less Savings | Temporary survival mode (tight months, high-cost area) |
| 30/20/50 | Massively boosts Savings | Low fixed costs + big savings goal (or a short sprint) |
The rule-of-thumb for “when to bail” is simple: if you’re consistently forced to shove Needs far above half for reasons you can’t control (rent, medical, childcare, basic transportation), reframe the budget around what you can move. That usually means optimizing fixed costs when possible, then deciding whether the next lever is Wants cuts or income increases.
Also: if you’re tackling high-interest debt, you may intentionally push more than “a fifth” toward payoff for a while—because interest doesn’t care about aesthetic budgeting ratios. Guidance that combines debt with savings is essentially acknowledging that reality.
How to run the rule inside Forbidden Finance
In Forbidden Finance, the easiest way to make the rule real is to treat it like a three-bucket game plan, not a sacred spreadsheet.
You start with three target groups: Needs, Wants, and Savings, each with a default percentage you can customize; as long as the total stays at 100%. If rent is eating your soul, you can adjust to something like 60/20/20 without pretending your landlord cares about personal finance TikTok.
The setup that makes the rule feel doable
The workflow is basically “set targets, auto-sort, then sanity-check,” which is exactly what percentage-based budgeting is good at.
Here’s how it plays out in the app, step by step:
- Your spending categories are automatically mapped into the three buckets using category “type tags” (need, want, savings). Rent and groceries go to Needs, dining out goes to Wants, investment contributions go to Savings.
- Total income for the period is computed automatically from income-tagged transactions.
- Each bucket’s budget is calculated by multiplying that income by your chosen percentages.
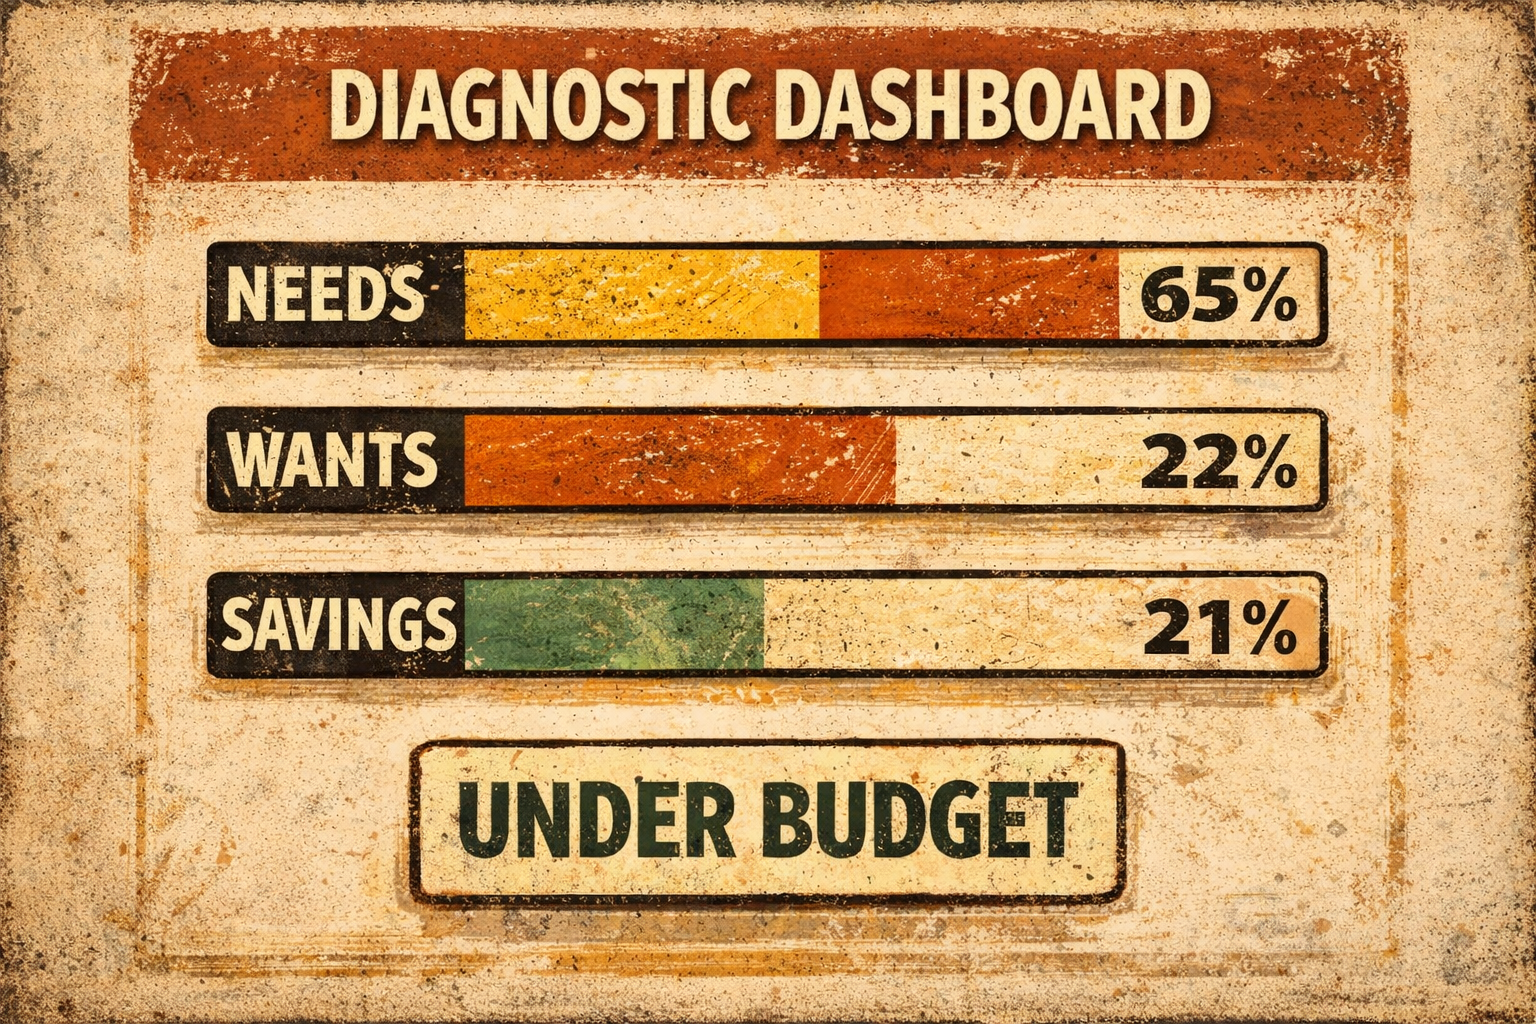
- Your dashboard shows percentage adherence per bucket and clear “Over Budget” / “Under Budget” statuses per bucket.
This turns the rule into a recurring check-in: “Am I roughly balanced?” instead of “Did I log my $3.62 iced coffee and flag it as emotional instability?”
A very unsexy weekly routine that works
Check your dashboard once a week. If Needs are running hot, you don’t punish yourself, you decide whether it’s a one-off, a seasonal spike, or a structural problem that needs a structural fix.
Then you adjust the percentages on purpose. The win condition isn’t matching the original rule; the win condition is consistently funding future-you while keeping present-you functional.
And yes: it’s available on the Free tier, so you can start without paying a subscription just to learn that groceries cost money now. Remember, though, for automatic bank connections, you will need the Starter tier.